
Amplytico participates in the E-Verify program
Certified Small Business (SB/MB)
Certified Great Place to Work
582 Market St, Ste 1601, San Francisco, CA 94104
operations@amplytico.com
Copyright 2024 Amplytico Inc.
February 4, 2026
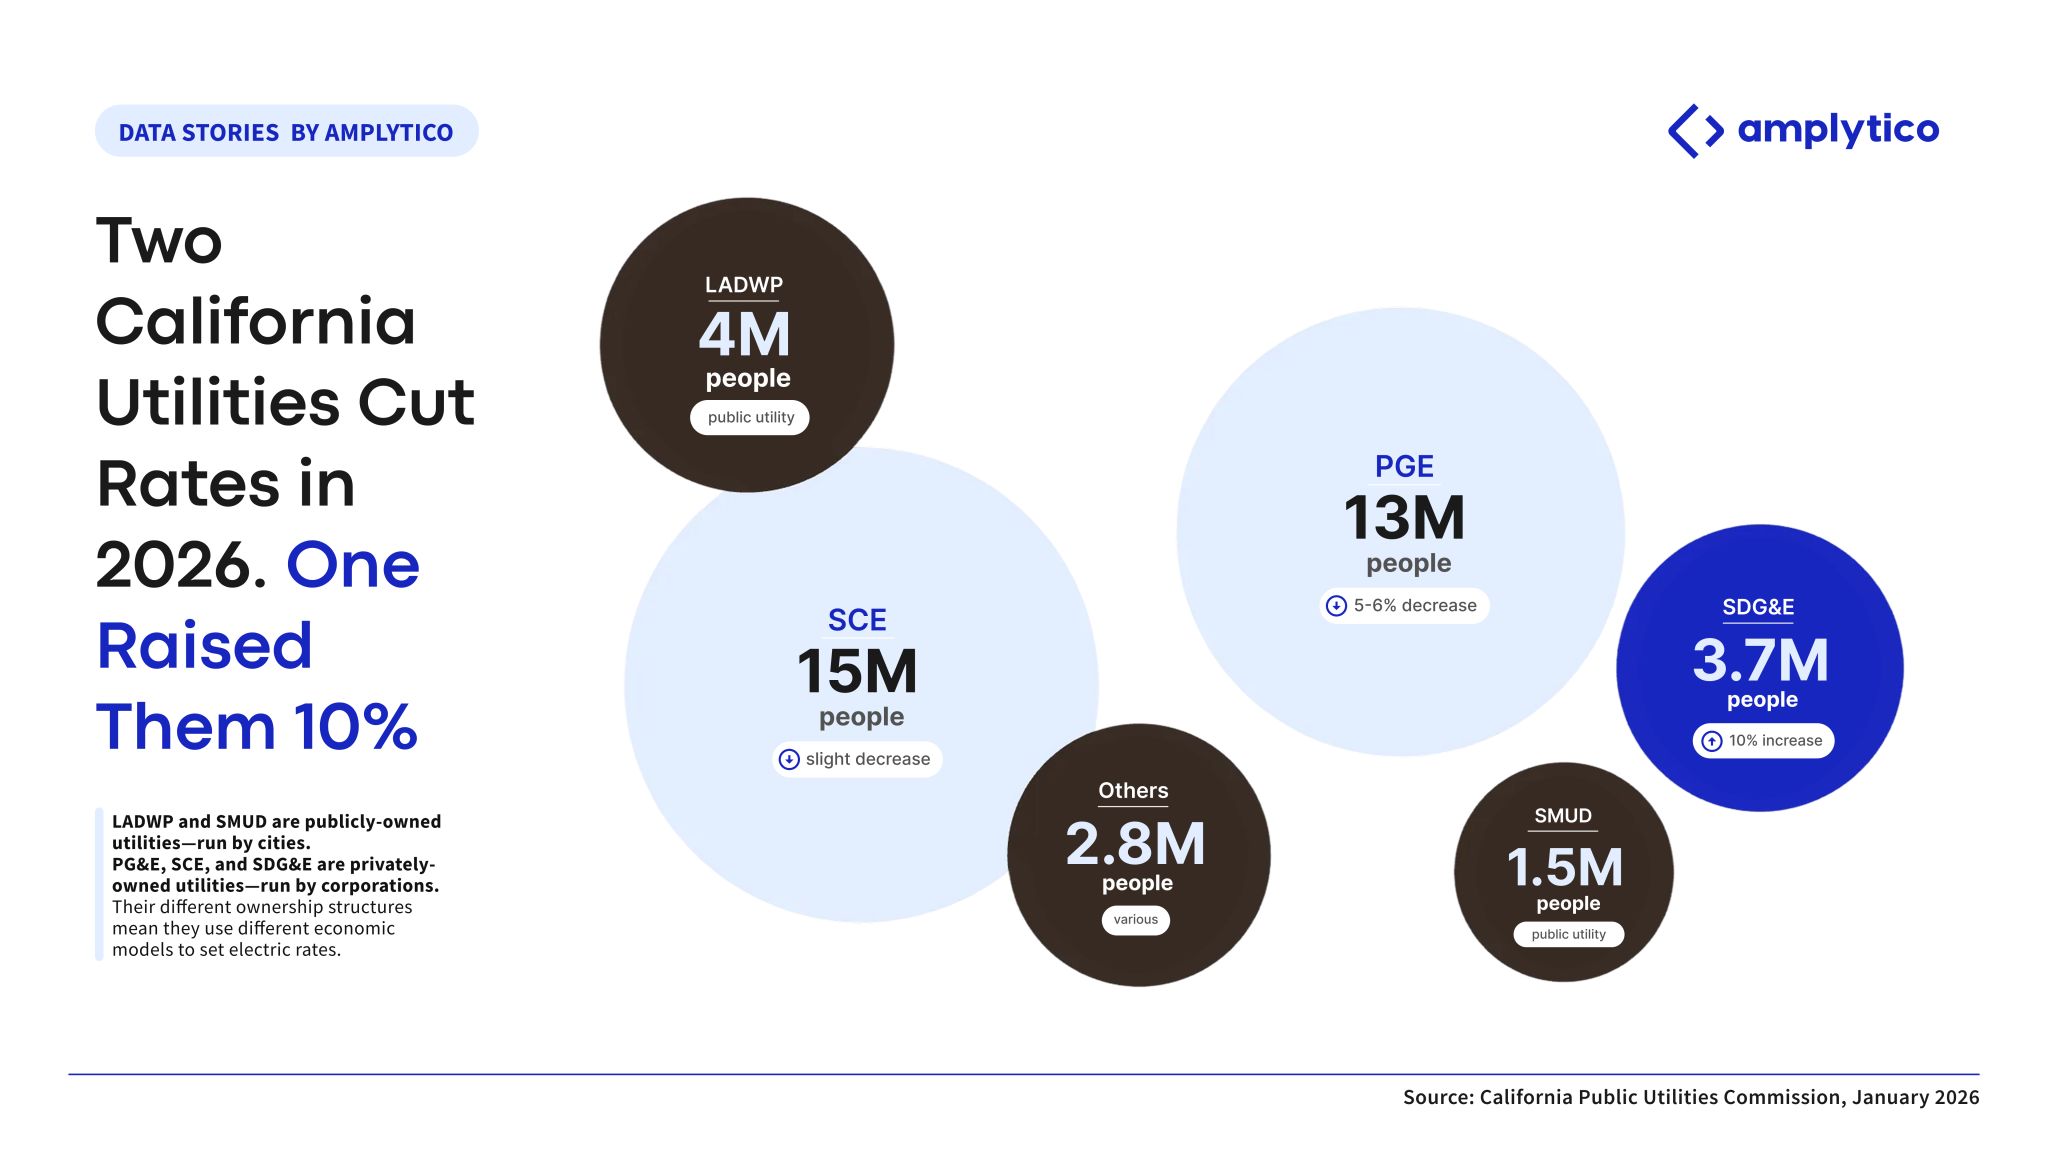
California's electric bills changed on January 1st, 2026—but did yours go up or down?
The answer depends entirely on which utility serves you.
Our latest Data Stories visualization reveals a striking divergence: California's three largest investor-owned utilities serve 32 million people, yet they took completely opposite rate paths this year.
The Numbers:
- PG&E (13M people): Rates ↓ 5-6%
- SCE (15M people): Rates ↓ slight decrease
- SDG&E (3.7M people): Rates ↑ 10%
Why the split?
PG&E and SCE benefited from lower power generation costs and favorable accounting adjustments. Meanwhile, SDG&E's 10% increase reflects billions in wildfire mitigation spending and capital recovery needs. The visualization also shows California's publicly-owned utilities (LADWP, SMUD, and others) serving 8.3M people. Unlike their investor-owned counterparts, these municipal utilities don't need to generate shareholder profits—meaning their rate structures follow different financial pressures.
Together, these six entities serve all 40 million Californians. But as this chart makes clear: your utility company matters as much as your energy usage. What's happening in your service territory?
Source: California Public Utilities Commission (January 2026), California Energy Commission